Retrieval Augmented Generation

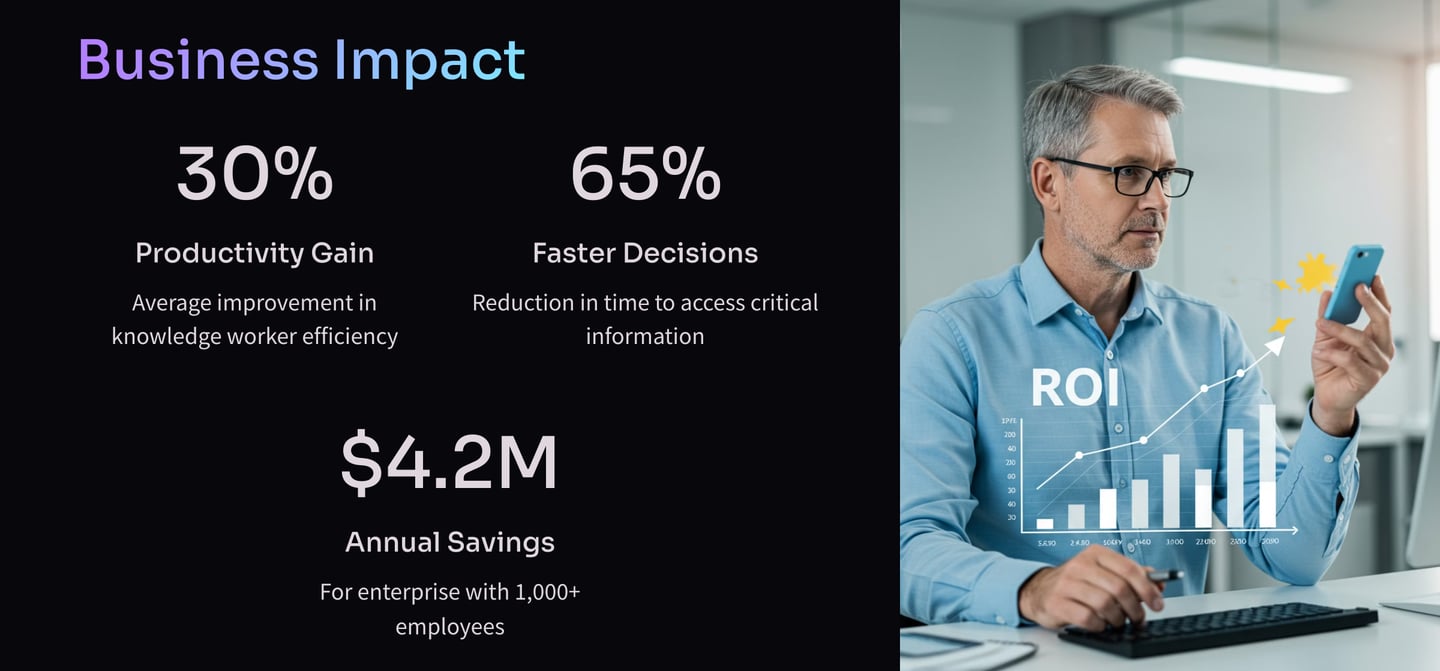
When you are drowning in documents, our knowledgebase search, retrieval and generation application enable your organization to tap into your collective knowledge.

How it works

Here’s how we can help you

Search and query your knowledgebase through a simple, conversational interface.
Improve Knowledge Management
Boost Operational Efficiency
Accelerate routine analysis and surface actionable insights from your information.
Automate Workflow
Free your team to focus on high-value work with automated answer retrieval for common tasks.

Knowledge Management

Streamline information access and enhance decision-making efficiency for businesses.

A laptop with an open screen displaying dashboard analytics featuring charts, graphs, and numerical data related to sales and subscriptions. The interface is predominantly dark-themed with sections highlighting key performance metrics. The device shown is a MacBook Pro, indicated by the keyboard layout and branding.
A close-up view of a computer motherboard with a prominent microchip labeled 'AI' at the center. The board is densely populated with circuits, capacitors, and other electronic components in various shades of gray, black, and gold.
A computer screen displaying a data analytics dashboard with graphs and charts. A blue line graph shows fluctuations in data over time, and a section highlights the number of page views. A pie chart is partially visible, indicating a breakdown of different data elements.
A laptop displays a webpage titled '150 ChatGPT copywriting prompts' with a logo above the text. It suggests using AI to improve copywriting skills. On the left, part of a colorful sandwich is partially visible, adding a contrast to the academic theme on the screen.
A person is viewing a map with red data points on a computer monitor, likely indicating a geographical distribution. The image has a focus on technology and data analysis.
A digital rendering depicting a tall, metallic server rack positioned centrally on a platform. The server appears to have multiple blue-lit slots. Surrounding the rack, there are several stacks of cylindrical objects resembling databases or storage units, all set against a dark background.